 How to create infographics
Infographics are graphic illustrations of data that are usually used for presenting information under the form of tables, flowcharts, diagrams, bar charts, histograms, and many others. These types of graphic representations have been around for quite some time being used to show weather conditions in the newspapers or transit systems in the bus stations. Nowadays, you can see infographics almost anywhere, whether they're included in TV commercials, social media web interfaces, and even music videos.
So, it's no surprise that many applications were created over the years to provide you with useful features and help you design quality infographics with minimum effort. Among the most popular tools lies Microsoft PowerPoint, an app that can easily be handled even by a user with little experience in graphic design. The Internet is filled with free infographic elements for PowerPoint projects as well as free sample illustrations which can be used for inspiration. PowerPoint infographic templates can be downloaded from the web without paying a buck, and you can easily add a personal touch from the popular Microsoft app.
Another good example comes from Inkscape, an open source vector graphics editor which offers you various drawing capabilities, lets you export your projects to various formats, etc. Adobe Illustrator is also a feature-rich alternative and is definitely worth its price. However, not all of them come with affordable prices (CorelDRAW) as they were created for professional graphic designers and can be used for more than just creating infographics.
Before starting your design project, you need to establish the 3 infographics components: visual, content, and knowledge. Obviously, the visual part consists of the graphics and colors you choose to use in your design project. Interesting facts or statistics can be presented as content. As for the knowledge, the most important element of an infographic, it's the insight into the data that you are choosing to present.
Tutorial assets
You will need to download the following software to follow along with this tutorial.
Adobe Illustrator
Originally developed only for Mac computers, this vector graphics editor is packed with powerful drawing tools, free infographic templates, and sample images, and project presets to help you complete your work a lot faster. The application is part of the Adobe Creative Cloud service which requires a monthly or annual subscription. As long as the subscription is valid, you can download Adobe products from the homepage of the developer and use them on your PC.
Adobe Illustrator can be used to create eye-catching infographics for viewing on almost any media device. You can choose between multiple vector shape tools and text editing options, crop images without quality loss, easily draw pixel-perfect art, and so much more. Everything you could possibly need from a vector graphics editor can be found in this program. Even though the interface might seem a bit overwhelming because ofthe large amount of buttons and toolbars, every built-in tool can easily be located and configured according to your needs.
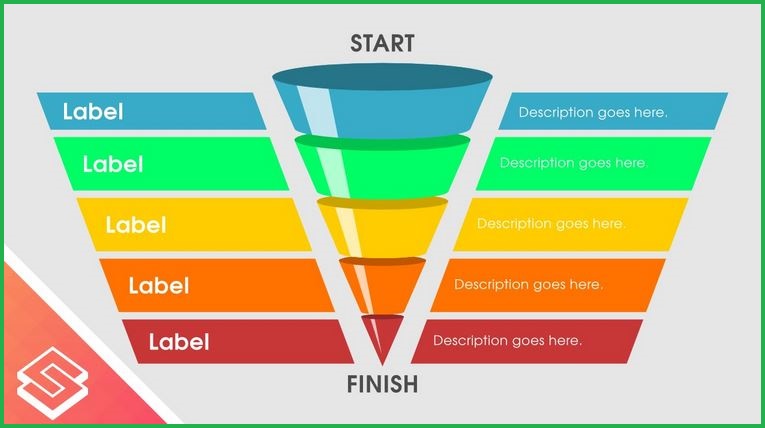
 Infographic Sample Created With Adobe Illustrator
The Adobe company provides you with multiple purchasing plans, based on the amount of time you're planning on using the vector graphics editor on your Windows PC. There's also the option to acquire a package that contains Adobe Illustrator, additional sample images, and other tools which were created by the same developer, like Photoshop CC. It's quite a deal if you're the kind of Windows user who is specialized in graphic design and uses this type of programs on a daily basis.
Pros: If you want infographics that are designed with precision, then Illustrator is the utility for you. Also, it offers you an insane amount of built-in editing options and high-quality output designs.
Cons: It might take a while to launch the application. It also takes some time to import files.
CorelDRAW
A more expensive solution for creating infographics comes from the CorelDRAW application. Besides offering you a wide variety of drawing tools to create your quality two-dimensional designs, this utility also provides you with a quick way to find the perfect font styles for your projects, supports dozens of output formats, comes with many useful design instructions, and so much more.
Another advantage is that you have access to the built-in LiveSketch utility which enables you to capture your original infographic ideas on your pen-enabled device. You can easily use it to draw connector points, a circle of arrows, pie charts, and many others. What's more, the application is able to convert your free-form sketch into precise vector curves.
 Infographic Sample Created With CorelDRAW
CorelDRAW is also packed with a large collection of clipart, digital images, TrueType and/or OpenType fonts, and free editable infographic templates which can be used for creating your projects.
Pros: It gives you access to a comprehensive learning material, lets you customize the appearance of your workspace according to your needs, and helps you build various types of projects (website design, logos, posters, flow charts, bar graphs, etc.).
Cons: Pricey.
Inkscape
Last but not least, you have Inkscape, a vector graphics editor that, unlike the aforementioned tools, comes without a price. With its help, you can design tables, infographic icons, web graphics, etc. The application has sophisticated drawing tools with capabilities comparable to programs like CorelDRAW and Adobe Illustrator. Its calligraphy and text editing utilities are quite remarkable.
Furthermore, Inkscape also brings you powerful object manipulation capabilities. You can easily move, rotate, group, or align elements from your graphic design. Another great aspect is the fact that Inkscape provides you with the support of a wide variety of file formats. You can download free infographic templates from the web and import them in Inkscape for editing. Also, the output quality is excellent no matter which output format you choose.
 Infographic Sample Created With Inkscape
Pros: Free and feature-rich.
Cons: Not as intuitive as CorelDRAW or Adobe Illustrator.
Conclusion
Briefly, these 3 applications are among the best graphic design tools for creating your infographics on Windows PCs. In my opinion, Inkscape is by far the best infographics solution as not only it provides you with countless useful features, but it also comes without a price. Still, it's up to you to decide which program for you based on your needs and budget.
Alternative downloads
-
 CorelDRAW Graphics
Suite
$399
windows
Collection of programs to help you create vector illustrations...
Download
CorelDRAW Graphics
Suite
$399
windows
Collection of programs to help you create vector illustrations...
Download
-
EdrawInfo
$69
windows
Edraw Infographic is a simple infographic software with lots of built-in icons and ready-to-use templates.
Download
-
Inkscape
free
windows
The design process may begin by doodles on a napkin, a sketched mindmap, a photo of a memorable object...
Download


Comments
Subscribe to comments